Tracking mRNA from Efficacy to Effectiveness
Recent news around the promising mRNA vaccines targeting cancers results indeed caused great excitement in many circles. The number of mRNA clinical...

A few weeks ago, I, like many other masochistic Americans, decided to see the highest grossing September movie ever, IT. Unlike most other people, I happened to have been testing a wearable medical grade biosensor, which captures my Electrocardiogram (ECG), and my body motion through a 3-axis accelerometer.
I'm a data scientist here at physIQ, and spend most of my time developing new algorithms for people with chronic diseases like heart failure and COPD. The data that I collected from myself as I was terrified by Stephen King's IT seemed too interesting not to share with a wider audience, so here I am writing this blog post.
While we at physIQ work on developing device-agnostic algorithms, we really like the VitalPatch from our partner company VitalConnect, Inc. The disposable VitalPatch biosensor resembles a Band-Aid and is worn on the upper chest 24 hours a day, for up to 4 days. Among other features, it continuously collects two main signals, ECG and 3-axis accelerometry, which are transmitted in real time to the physIQ platform via Bluetooth to a smart phone. From these two signals, we can compute a vast array of metrics and analytics including measures of cardiac performance, arrhythmias, activity recognition, sleep apneas, and more.
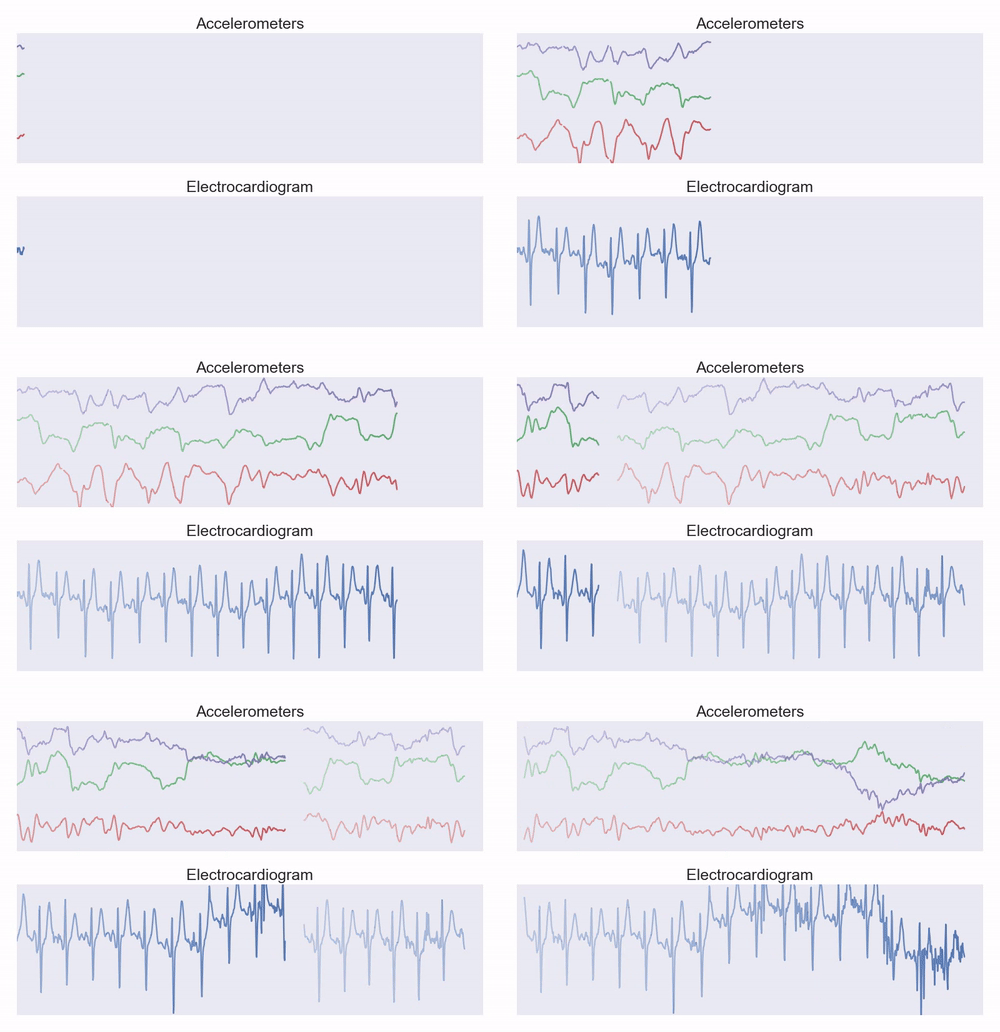
There is little doubt this new world of data generated by wearable and implantable biosensors will transform medicine. However, the prospect of making sense of this information seems terrifying. Finding the best ways to analyze and interpret these ambulatory signals is the key to overcoming data-phobia. To get an idea of what the raw data looks like, here's an example of me walking to my seat and sitting down as the movie starts. This is the type of data that we collect and analyze 24 hours a day for high risk, chronically ill individuals.

I don't know much about cinematography, but when I looked at my data I immediately noticed something: I could see the shape of the movie in my physiological data.
What do I mean by shape of the data? Well, some quick googling about typical movie plot structure pulled up the following image:
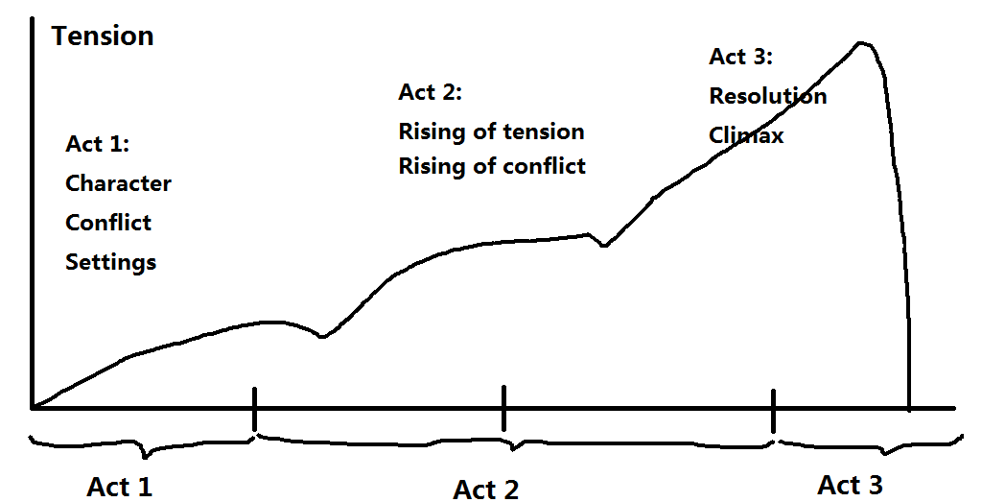
 Apparently, one of the most common movie (and story) devices is the three act structure. The y-axis is labeled "tension", with each act increasing in tension to a max, decreasing slightly, then continuing to increase as the next act begins. At the end of the third act, the tension peaks at the climax, then quickly drops off during the resolution.
I could see the same thing in my heart rate!
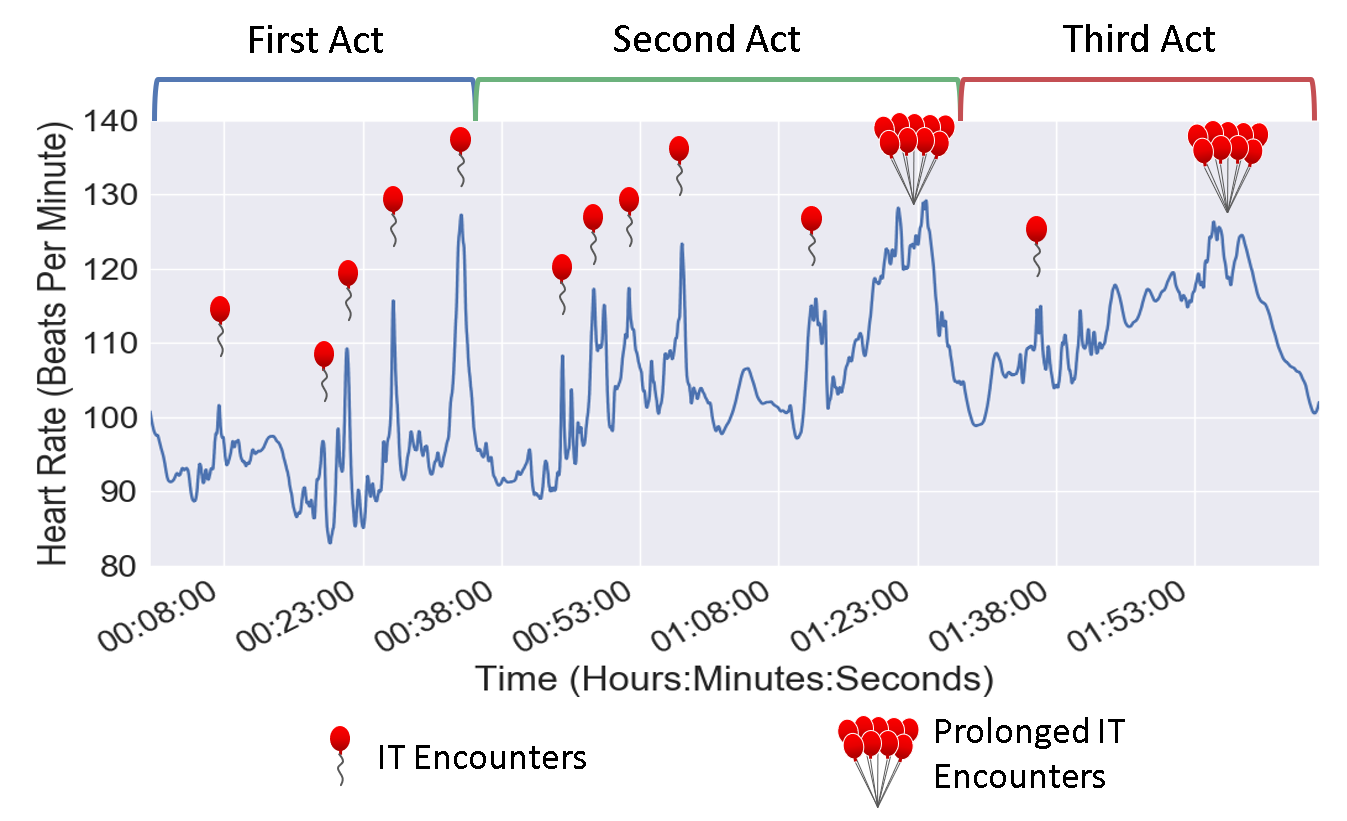

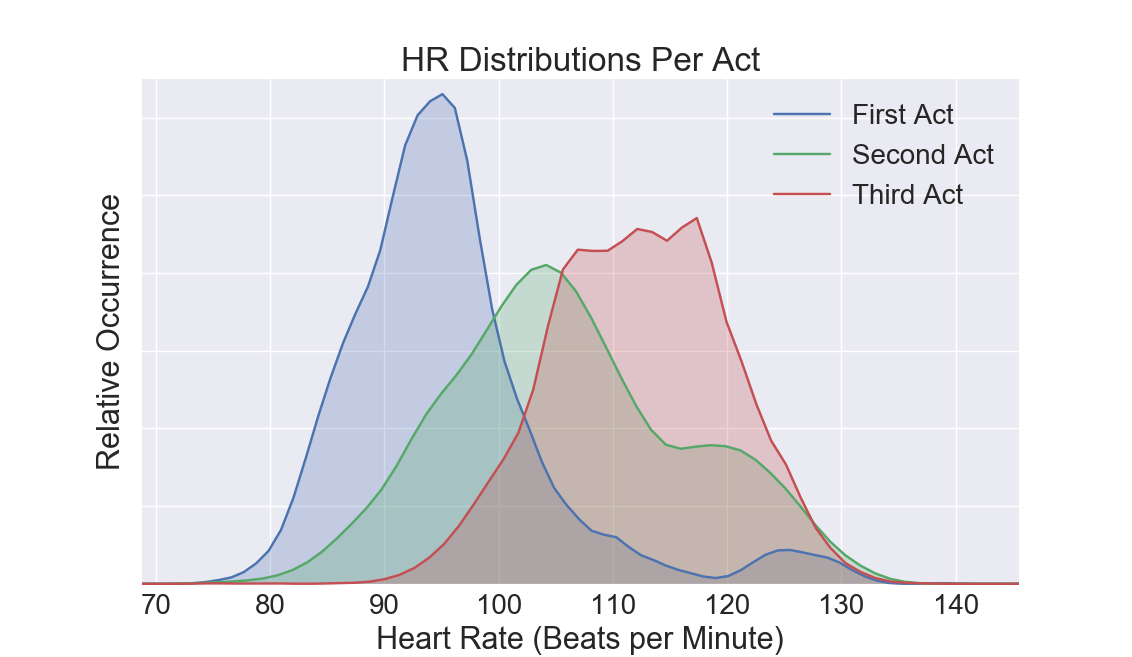
It looks like my heart rate rises and reaches a climax for each act of the movie, and my heart rate during each act increases until the final climax of the movie. This is especially obvious if we plot the heart rate distributions per act, as shown below.

One might also notice that I was scared a lot during this movie. In the first act, the scares tended to be quick, and my heart rate rapidly shot up and just as quickly returned to baseline. As the movie progresses, we see more and more of Pennywise the clown, and the jump scares transition to prolonged and increasing dread.
The physiological response to fear is mediated by the autonomic nervous system (ANS). The ANS unconsciously prepares muscles and organs in the body for situations encountered in the environment. The ANS is composed of two parts with complementary functions: the sympathetic nervous system (which responds to "fight-or-flight" situations), and the parasympathetic nervous system (which responds to "rest-and-digest" situations). The sympathetic nervous system is activated during fear-inducing events, leading primarily to increased heart rate, pupil dilation, changing blood pressure, etc. [4]
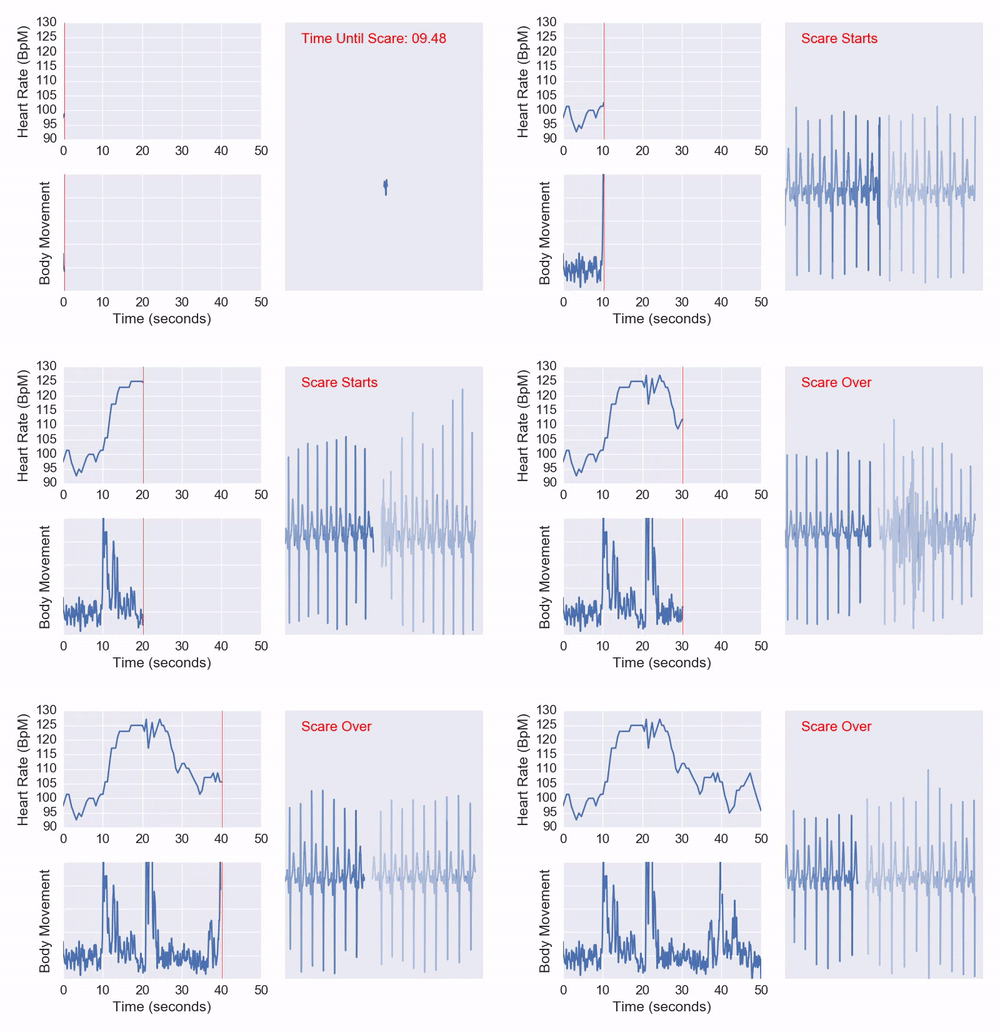
Let's take a look at one of the early jump scares (the fourth balloon in the plot above). When the scare starts, I literally jump in my seat. Immediately after, my heart rate follows by jumping from about 95 beats per minute, to 125 beats per minute over just a few seconds. After the scare abruptly ends, my heart rate is back down to 95 bpm in 20 seconds.
 The Growing Dread
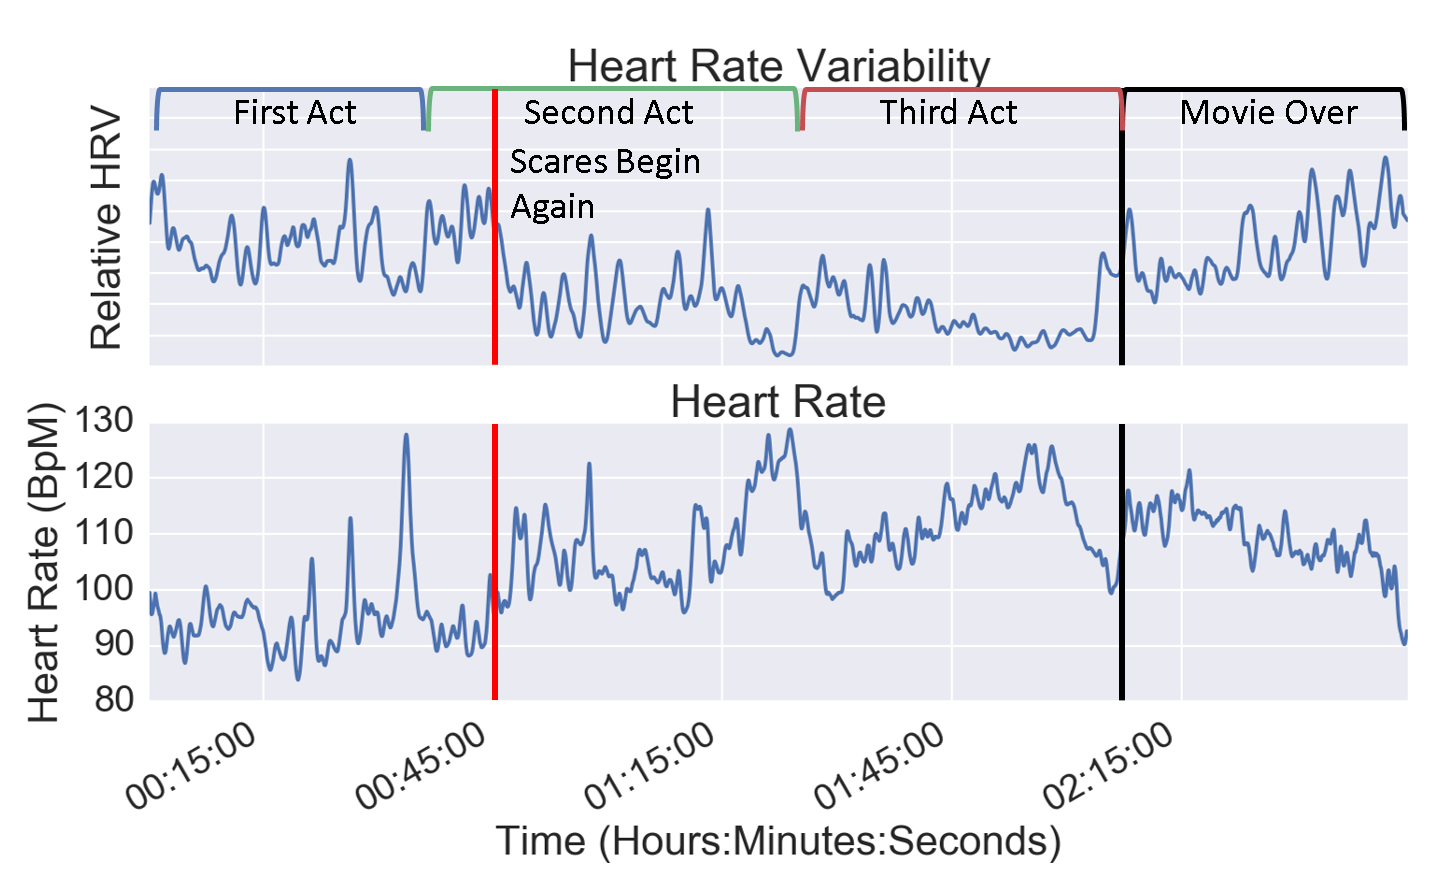
Many studies have found [2][3][5] that increased sympathetic activation, either through drugs or stress inducing situations, can lead to a reduction in Heart Rate Variability (HRV). There are many ways to compute HRV [1], each with different clinical utility. Here, I examined the time domain HRV to see sympathetic activation. This type of HRV is computed by looking at the extent of heart rate variation over a small time window (~10 seconds).
Interestingly, my HRV decreases significantly beginning with the second act, even though I clearly was scared several times during the first act. Perhaps this is the point that my unconscious realized that the threat of a crazy clown wasn't going away, and more fully activated my sympathetic nervous system. After the movie ends (actually a little before), my HRV immediately shifts back to a more normal level, even though my heart rate stays elevated for some time after the end.

As you can see, there's all sorts of physiological information which we can mine, and physIQ's analytics platform allows clinicians to capture the same depth of information about chronically ill patients. While the amount of data produced by wearable biosensors may seem frightening, this wealth of data can be transformed into meaningful clinical insights.
So really, there's nothing to be afraid of.
Until next time!


[1]. Electrophysiology, T. F. of the E. S. of C. the N. A. S. of P. (1996). Heart Rate Variability. Circulation, 93(5), 1043 LP-1065. Retrieved from http://circ.ahajournals.org/content/93/5/1043
[2]. Evans, S., Tsao, J. C. I., Lung, K. C., Zeltzer, L. K., & Naliboff, B. D. (2013). Heart rate variability as a biomarker for autonomic nervous system response differences between children with chronic pain and healthy control children, 449–457.
[3]. Frazier, T. W., Strauss, M. E., & Steinhauer, S. R. (2004). Respiratory sinus arrhythmia as an index of emotional response in young adults. Psychophysiology, 41(1), 75–83. https://doi.org/10.1046/j.1469-8986.2003.00131.x
[4]. Kreibig, S. D., Wilhelm, F. H., Roth, W. T., & Gross, J. J. (2007). Cardiovascular, electrodermal, and respiratory response patterns to fear- and sadness-inducing films. Psychophysiology, 44(5), 787–806. https://doi.org/10.1111/j.1469-8986.2007.00550.x
[5]. Sztajzel, J. (2004). Heart rate variability: A noninvasive electrocardiographic method to measure the autonomic nervous system. Swiss Medical Weekly, 134(35–36), 514–522. https://doi.org/2004/35/smw-10321
Image of Story Structure:
https://commons.wikimedia.org/wiki/File%3ATension_of_three_act_structure.png
By UfofVincent (Own work) [CC BY-SA 4.0 (https://creativecommons.org/licenses/by-sa/4.0)], via Wikimedia Commons
Recent news around the promising mRNA vaccines targeting cancers results indeed caused great excitement in many circles. The number of mRNA clinical...

The recent wave of public interest in several groundbreaking studies of mRNA vaccines in the treatment of cancer are perfect examples of how the rise...

Prevention, early detection, and vigilant patient monitoring are critical elements in successfully and cooperatively managing patients with heart...